by Mike Donnelly
5 June 2017
Download Energy Harvesting datasheet
Wireless sensing technology is the data source for many new IIoT and automotive applications. These systems need electrical power to operate the sensor and signal conditioning circuits, as well as for data processing and transmission. A common problem for these systems is the limited lifetime of batteries and the cost of replacing them. One approach that can extend that lifetime, or even eliminate the need for batteries, is Energy Harvesting (EH). With EH, the sensing system includes a mechanism to extract waste energy from the local environment and convert it to useful electrical power.
The following examples are intended to show relevant modeling and simulation capabilities of PartQuest Explore for designing EH systems. They are not intended to be practical EH reference designs, but rather to show the tool's ability to support knowledgeable users who are creating practical designs. The reader can open any of these designs and interact with the “live” version, or save a copy and make any desired changes, then re-simulate and see the effect of those changes.
Kinetic Energy
The first example shows an electrodynamic EH system that could be used to extract energy from the vibration of an industrial motor, or potentially be adapted for kinetic energy extraction in an automotive tire pressure monitor system.
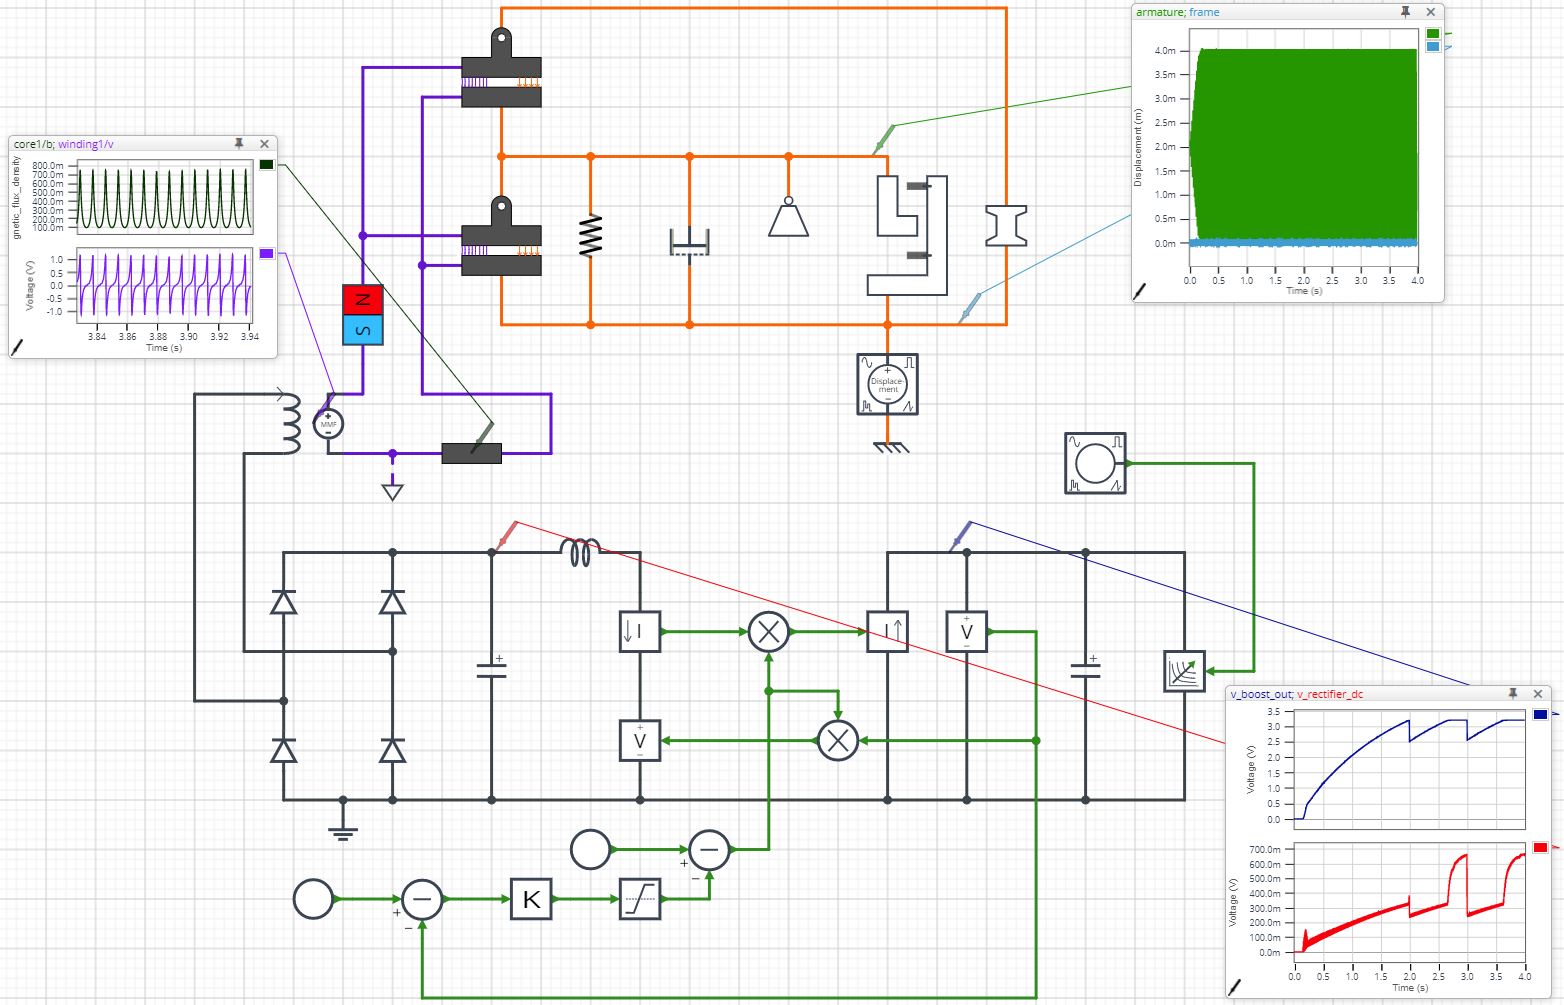
Electrodynamic Vibration Energy Harvesting
The mechanical and magnetic circuit sections of the design are composed of "physical" models. The user can directly specify the size and/or physical properties of the components, including the mass of the armature, the spring stiffness, the cross section area and length of the magnetic core, the residual flux density of the permanent magnet and the number of winding turns. This model is therefore suitable for the design of the energy harvesting mechanism itself. Later examples focus on integrating the basic EH mechanism, represented by a “behavioral” model (i.e. defined only by the device’s externally observed characteristics), into the rest of energy harvesting system.
The electronics section contains a mix of passive analog elements for the rectifier circuit, as well as abstract math/building-block models to represent the state-average (non-switching) behavior of the boost converter. Finally, a purely behavioral “constant power load” model represents the periodic power demand for data transmission.
The simulation results in the upper right show the amplitude of the external vibration source of 0.07mm peak at 60 Hz, equivalent to a peak acceleration of 1g (light-blue waveform). The armature spring-mass resonance frequency is 60 Hz, so the armature displacement is quite large and is seen to reach the frame's travel limit of 4 mm peak-to-peak (green waveform).
In the upper left, the zoomed-in waveforms show the core flux density and winding voltage. In the lower right, the relatively low rectified (DC) voltage from the generator (red waveform) and the boosted and regulated output voltage (dark blue waveform) are shown.
Thermal Energy
The second example is an electro-thermal EH system with a sampled-data algorithm for maximum power point tracking (MPPT). This example could be for an industrial process or an automotive engine sensing application, anywhere a waste heat source provides a relatively high temperature (e.g. near water’s boiling point) with a nearby room temperature ambient condition.

Electrothermal Energy Harvesting - MPPT Capacitor Charging
The open-source algorithm, which optimizes the energy harvest under time varying temperature conditions, can be seen by selecting “View/Copy Model” for the MPPT-TEG in the live version of the design. The design’s “hardware” includes a thermoelectric generator (TEG) with a "hot" side temperature that varies between 75 degC and 100 degC. The "cold" side is held at a fixed 25 degC. The thermal resistance and heat capacitance of the hot-side plate are shown in the schematic. And, as in the previous example, the electronics section includes a mix of analog circuit elements (a super capacitor, inductor, linear regulator IC, etc.) and math/building-block models to represent a buck-boost converter.
The goal of the design is to extract the maximum power from the TEG, in order to charge the 1 Farad super capacitor to its 5.5 V operating limit as quickly as possible, so that it is ready to provide a 2.5-Watt/1-second duration power burst once every 10 seconds. The MPPT algorithm achieves this goal by dynamically adjusting the converter’s input current control set-point, to keep the TEG load current at its maximum power point. The power output of the TEG varies not only with load current, but its peak power point varies with the differential operating temperature. This can be easily verified using the TEG calibration circuit here: TEC/TEG calibration test schematic
Solar Energy
The last EH example is for a somewhat higher power solar charging system for a 12 V automotive battery. The first view of the design can be used for a system-level trade-off analysis, comparing direct solar battery charging vs. using an MPPT algorithm combined with a buck converter.
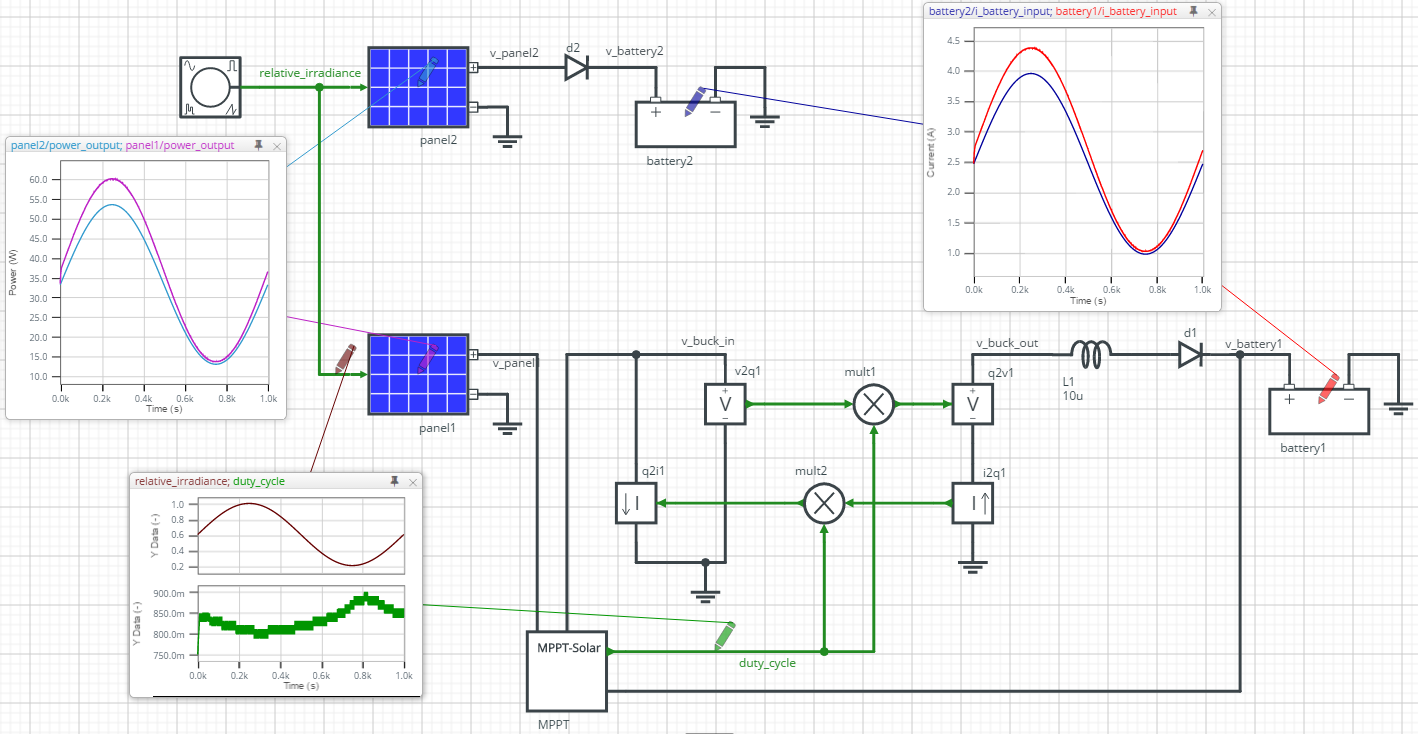
Solar Energy Harvesting - Compare Direct vs. MPPT Battery Charging
The behavioral solar panel model in this system allows the user to specify not only the "boilerplate" electrical characteristics (i.e. the open circuit voltage, short circuit current and peak power output capability), which are always given at the full or nominal irradiance level, but also to specify the reduced output and shift in the peak power point at lower irradiance levels. This shift in the load voltage at which peak power transfer occurs, gives rise to the performance improvement that can be achieved with MPPT (maximum power point tracking) when the irradiance level varies over time.
This MPPT algorithm dynamically adjusts the buck converter’s state-average duty-cycle value, to keep the solar panel operating at its peak power output. The user can adjust various "tuning" parameters of that algorithm (e.g. sample rate, the duty-cycle "delta" or perturbation used for tracking, etc.). The simulation results show clear improvement in both panel output power (magenta vs. light blue waveforms) and battery input or charging current (red vs. dark blue waveforms), for MPPT vs. direct charging, respectively. Also, the actual duty-cycle "hunting" or peak power tracking operation is visible in green waveform, as the irradiance level varies as a sinusoid (brown waveform).
The second view of the solar charging design is at the circuit implementation level of a buck converter’s power stage. Whereas the system-level view supports conceptual trade-offs and comparisons, it does not account for some important aspects of a real converter implementation, such as the predicted power loss in the switching components, or the switching noise on the current and voltage measurements that are needed for power detection.

Solar Energy Harvesting - Implementation of MPPT Battery Charging
The circuit-implementation view shows the system at full solar panel irradiance, with the converter duty-cycle set to a fixed value of 0.8. That value was shown to provide maximum power under full irradiance. The simulation results confirm the system-level predicted performance: Steady-state panel power output at just under 60 Watts (light blue waveform); Current into the battery at 4.5 A (red waveform); Expected voltage (16 V) and current (3.7 A) into the converter (magenta and green waveforms, respectively). Note also that the input L-C filter removes most of the switching noise that would be visible on the voltage and current signals without that filtering effect.
Finally, note that the average power loss in the P-channel MOSFET is 1.3 Watts (brown waveform). This is important for assessing overall system efficiency, a key factor in the trade-off analysis with direct charging. On the “live” version of the design, the reader can move the waveform probes around and observe the power loss in all of the other components also, as part of the efficiency analysis process.
- 253 views